Power BI / FIG. D1 · E-COMMERCE
Toy Store E-commerce
A three-page report that checks the health of an online toy store, finds where shoppers give up before paying, and shows which products and customers really make money.
- SOURCE
- Maven Analytics · toy store database
- DATA
- Sessions, pageviews, orders, refunds
- PAGES
- 3
- BUILT WITH
- Power Query · DAX
01 · THE QUESTION
Is the store growing, and where is it leaking money?
The store sells online and buys its traffic mostly through paid search. Management wanted growth, conversion and profit on one screen, with each number pointing to an action.
- Q1Are sessions, orders and revenue growing year on year?
- Q2Which traffic source carries the business, and is that a risk?
- Q3At which step of the purchase journey do visitors give up?
- Q4Which devices and channels convert best?
- Q5Which products still make money after refunds, and which customers are worth keeping?
02 · THE DATA & CLEANING
From raw files to clean tables
Web sessions tagged with traffic source and device, every pageview, orders and order items, item refunds and the product list.
- a.Linked pageviews to sessions to rebuild the purchase funnel step by step.
- b.Kept the traffic source, campaign and device on every session so any rate can be split by them.
- c.Took refunds off revenue to report Net Profit, not just gross sales.
- d.Added a date table with day names to compare weekdays with weekends.
- e.Grouped customers into loyalty tiers, from Tier 1 repeat buyers to Tier 4 non-buyers.
03 · THE DATA MODEL
One fact table, described by its look-ups
FACT
Sessions & orders
DIMENSIONS
- Date
- Products
- Traffic source
- Device
- Loyalty tier
- Refunds
04 · REPORT PAGES
What's in the report
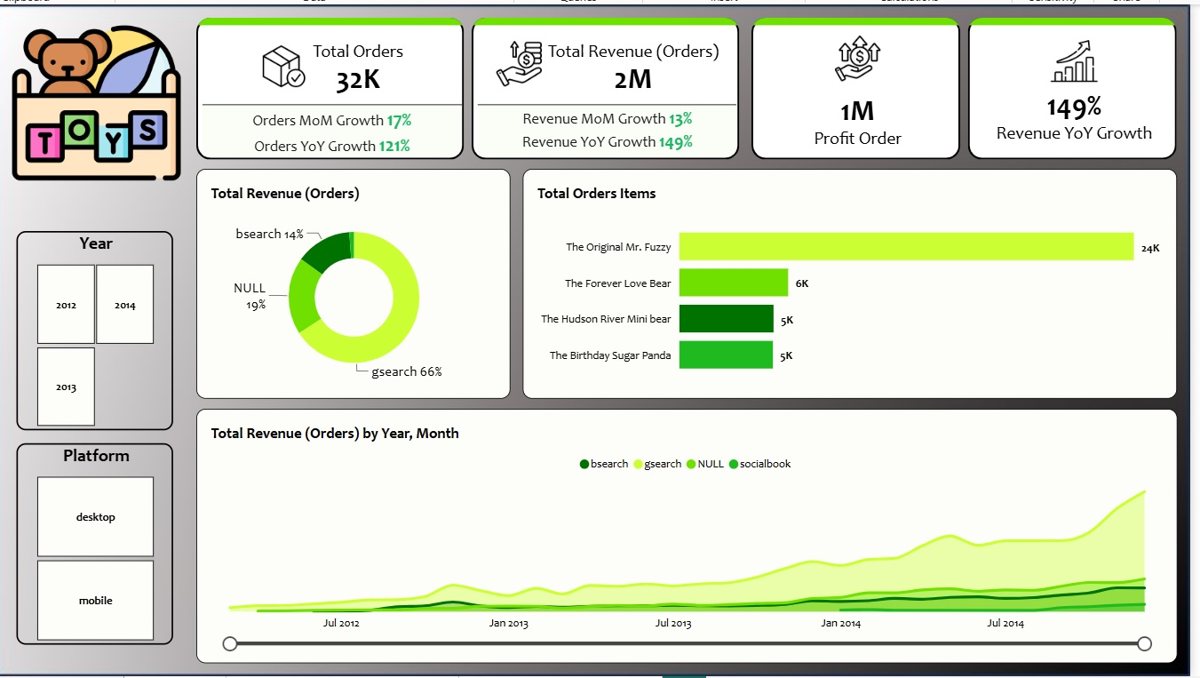
- P1OverviewBusiness health at a glance: revenue and orders year on year, traffic and revenue by source, and the revenue trend by date and weekday.
- P2Conversion & funnelHow well traffic turns into orders: the drop-off between each funnel step, and conversion rate and revenue per session by device and source.
- P3Product, profit & loyaltyThe bottom line: a product matrix of Net Profit against Gross Margin %, refund rate by item, and a heat map of loyalty tier against traffic source.
05 · FINDINGS
What the report shows
- A negative year-on-year sign on revenue or orders sends you straight to the funnel page to find the drop.
- When one source brings more than 70% of traffic and starts to decline, the whole business is at risk.
- The biggest single drop between two funnel steps, such as cart to shipping, is where most sales are lost.
- Lower mobile conversion means missed revenue at high volume, because so many visits come from phones.
- Repeat buyers from paid search are the most profitable cell in the loyalty heat map and define the ideal customer.
06 · RECOMMENDATIONS
What to do next
- 01Spread spend across more channels whenever one source dominates and slips.
- 02A/B test, speed up and shorten the form on the page with the largest drop-off.
- 03Put UX effort into mobile if it converts below desktop.
- 04Move budget toward the sources with the highest conversion rate.
- 05Work with product and shipping teams on items with high refund rates.
- 06Send targeted offers to non-buyers instead of general ads.
07 · TECHNICAL CHALLENGES
Problems solved along the way
- CHALLENGE 1Funnel from raw clicksPageviews are single events. They were ordered per session and counted per step with DAX so each drop-off rate is exact.
- CHALLENGE 2Profit after refundsRefunds were joined at item level, so a best-seller with many returns shows up as the liability it is.
- CHALLENGE 3Fair channel comparisonChannels differ in size, so they are compared on rates (conversion and revenue per session), not raw counts.
See it for yourself.
Open the live report →