Power BI / FIG. D5 · PRODUCTS
LEGO Sets
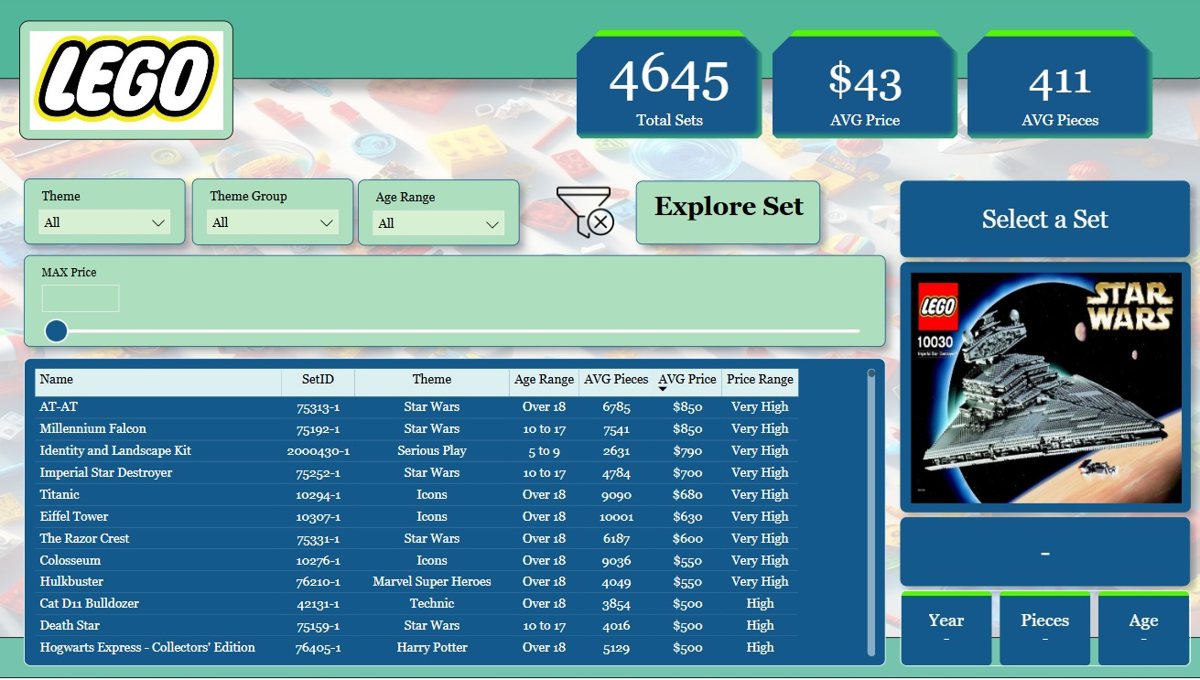
More than 18,000 LEGO sets from 1970 to 2022: how many were released, which themes lead, what they cost per piece and who they are made for.
- SOURCE
- Public LEGO sets dataset
- DATA
- 18,000+ sets, 1970 – 2022
- PAGES
- 4
- BUILT WITH
- Power Query · DAX
01 · THE QUESTION
How has LEGO changed in fifty years?
The dataset lists each set with its theme, pieces, age range, price and year. The goal was to see LEGO's product strategy over five decades.
- Q1How has the number of sets released each year grown?
- Q2Which themes dominate, such as Star Wars and Technic?
- Q3Is price per piece consistent, and which sets break the pattern?
- Q4How have age recommendations changed, and has LEGO moved toward adults?
02 · THE DATA & CLEANING
From raw files to clean tables
One large table of sets with name, theme, theme group, category, pieces, age range, retail price and release year.
- a.Handled missing values, especially missing prices and piece counts.
- b.Standardised text fields such as theme names.
- c.Converted columns to the right data types.
- d.Split themes, categories, years and age ranges into their own tables.
03 · THE DATA MODEL
One fact table, described by its look-ups
FACT
LEGO sets
DIMENSIONS
- Theme
- Theme group
- Category
- Year
- Age
04 · REPORT PAGES
What's in the report
- P1OverviewTotal sets, average pieces per set and overall price trends.
- P2ThemesVariety, piece counts and history of each theme, with a closer look at Star Wars and Technic.
- P3PricingPrice per piece over time and the outliers that point to premium or collector sets.
- P4AgeHow age recommendations have widened over the years, including sets for adults.
05 · FINDINGS
Key findings
- Releases grew strongly over the decades, with clear periods of expansion.
- A few themes, led by Star Wars and Technic, make up a large share of the range.
- Price per piece is fairly steady over time; sets far from the line are premium or collector items.
- Age ranges have widened, and LEGO now clearly targets adults as well as children.
06 · RECOMMENDATIONS
What to do next
- 01Marketing teams can see which themes keep their pull over time.
- 02Collectors can spot sets priced above the usual price per piece.
- 03Analysts get a clear view of how a toy brand widened its audience.
07 · TECHNICAL CHALLENGES
Problems solved along the way
- CHALLENGE 1Cleaning 18,000 rowsMissing values, mixed text and wrong types were fixed in Power Query before any analysis.
- CHALLENGE 2Drill-down that worksClear relationships between the sets table and its dimensions let users move from theme group to single theme without wrong totals.
- CHALLENGE 3Measures, not columnsPrice per piece, sets per year and average pieces are DAX measures, so they recalculate for any filter.
See it for yourself.
Open the live report →